Google Analytics is a free tool provided by Google to help you measure your marketing efforts. But Analytics is a BIG tool which can quickly become intimidating to the newbie.
To simplify your life and dip your toe in the water, here are 6 ways to set up and measure your marketing efforts if you’re new to using Analytics. The images included below are for an ecommerce site, which shows American Dollar values. If your site is a content publisher or B2B marketer, the columns will look slightly different.
#1: Claim your domain.
Sign in to your Gmail address and then go to Google Analytics.
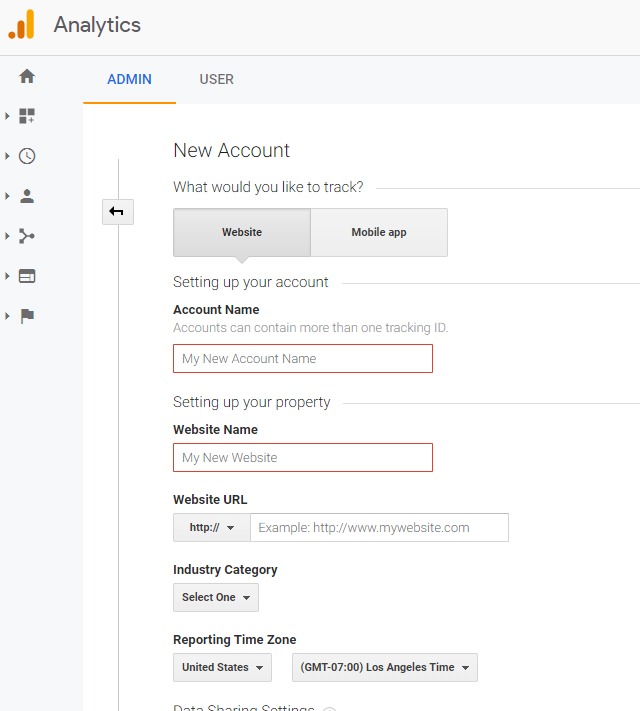
In the setup panel shown below, add your account name, usually the name of your business or holding company. Then add the name of the website being tracked, and finally the URL (homepage) of your website. We suggest copying the homepage address directly from your browser and be sure to choose the secure or non-secure version (https:// or http://) of your domain. Choosing the wrong version can lead to data irregularities. Select your industry category, timezone and any other basic info asked for.
#2: Install your unique Google Analytics tracking code
Next, in the bottom left, click on Admin, then Tracking Info/Tracking Code. This is where you access your unique analytics tracking code. Without this code on your website, analytics cannot collect visitor information. Your website developer can insert this code in the proper section for you, or if you’re using WordPress, there are a number of plugins which make this really easy. Most ecommerce platforms have designated areas where you can enter this tracking code. Make sure you highlight and copy the entire code.
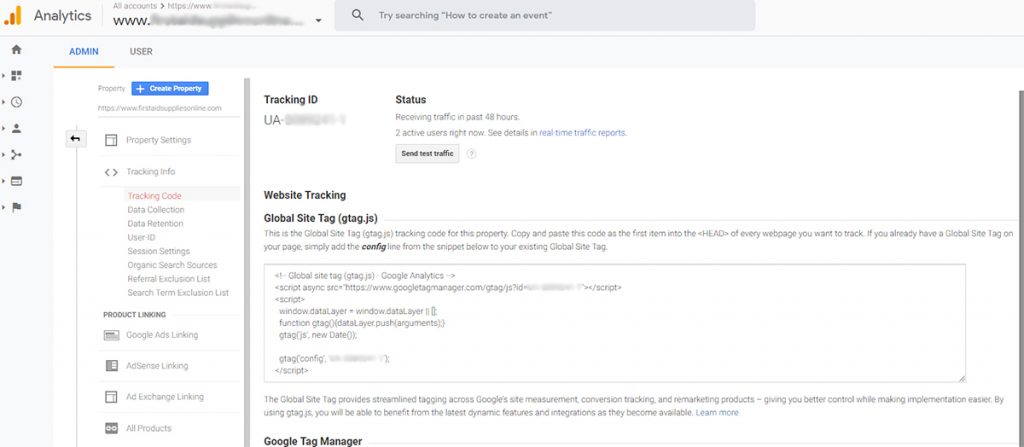
When the tracking code is entered on your website, analytics will start collecting data on your website visitors immediately. Use the Send Test Traffic button at the top of the panel to confirm that the code is working.
After 30 days or more, your home screen will look something like this:
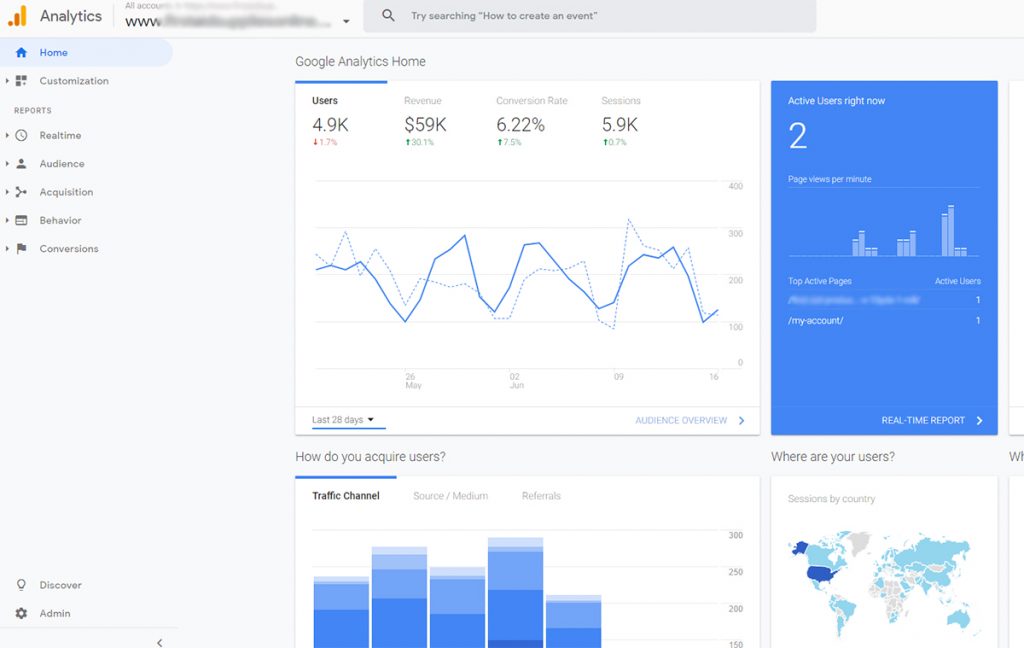
The menu on the left side of the panel offers many ways to slice and dice your data, depending on what’s essential for your reporting and analysis. We’re going to go over the basics of what most clients need to analyze the basics of their marketing.
#3: Google Analytics Audience Overview Report
Click on audience overview and select what time horizon you’d like to view in the upper right (as seen below).
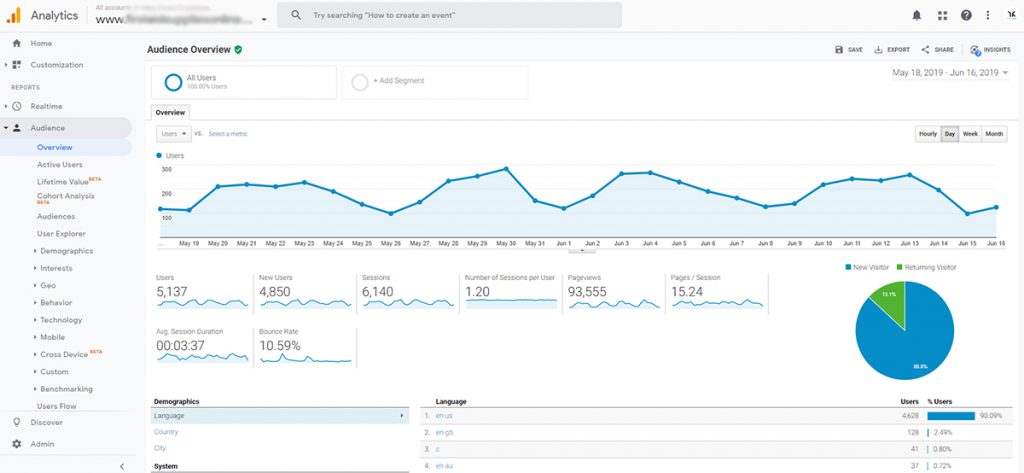
Here’s what the user data means:
- Users: How many people visited your site during the selected time.
- New Users: How many of those users never visited your site before.
- Sessions: A group of interactions with your website in a given time frame. For example, a single session can contain multiple page views, events, social interactions, and ecommerce transactions.
- Number of sessions per user: On average, how many sessions each user performed.
- Pageviews: The total number of pages viewed. Includes pages reloaded and viewed more than once.
- Pages/Session: The average number of pages viewed during a session. This includes repeat views of a page.
- Average session duration: The total duration of all sessions (in seconds) divided by the number of sessions.
- Bounce Rate: The percentage of single-page sessions in which there was no interaction with the page. Like golf, you’re aiming for a very low number here.
Note: non-ecommerce sites will show this data as:
- Sessions
- Users
- Pageviews
- Pages Per Session
- Avg Session Duration
- Bounce Rate
- % New Sessions
Think of the Audience Overview as the broad strokes of your user data. The next question is, how to interpret it?
That all depends on what’s important to you.
For instance, you might want to track how many users visited your site this month compared to last month or compared to this month last year (YOY); revenue for a certain period or user interaction during a promotion compared to the same length of time without a promotion; or how long users spent on certain pages; how many contact forms were submitted; which products were sold; and the list goes on.. There are thousands of ways to analyze your data and Google Analytics has many useful ways to present it.
We find that one of the most useful starting points in measuring your marketing is the Channels Report, which shows where website visitors users are coming from. This helps you shed light on which marketing channels are working and which are DOA.
#4: Google Analytics Channels Report
In the left panel, choose Acquisition, All Traffic, and then Channels
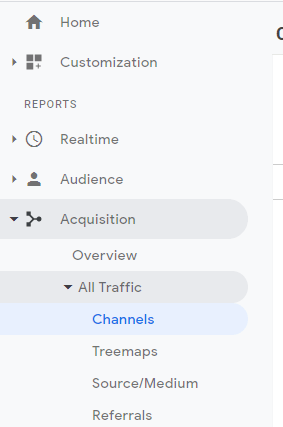
The default organization of the channels report is by users, but you can click on any of the columns to reorganize your data.
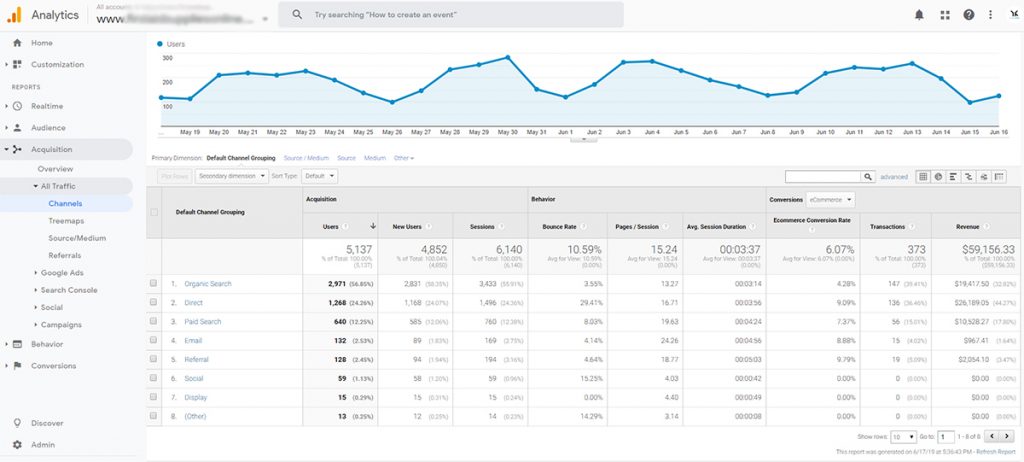
Definitions of the Channels report:
- Organic Search is your organic (free) website visitors from search results pages (SERPs) in Google, Bing, Yahoo, and other search engines. Click through on this to see search terms. Unfortunately, any traffic from Google is marked as (not provided) due to privacy concerns.
- Direct: This is a bit of a mess, quite frankly. It was originally intended to track any visitors who arrived by browser bookmark or by typing in the website URL. But now it can also include any traffic that goes from a non-secure to a secure page, missing tracking code, traffic from non-web documents (like a Word doc), and any other source that Google can’t identify.
- Paid Search: This is the traffic generated by any PPC advertising campaign: GoogleAds, Facebook, Bing, Yahoo, etc. Click on this to see the keywords which generated clicks on ads.
- Email: Users who visited your site when they clicked on a link in one of your emails.
- Referral: Traffic sent from 3rd party websites, such as business directories, publications, and vendor listings.
- Social: All traffic from organic social media posts. If the traffic came from a boosted post or ad on social media, that would fall under Paid Search (theoretically anyway – that’s not always the case)
- Display: Also PPC traffic, but from display ads like web banners.
- Other: This is the collective Google shrug or sources not mentioned above that get dumped in here. Click through to see these sources.
Note that only marketing channels in use will show here. If you’ve never sent an email campaign and consequently generated no visitors from email, the email channel will not show. Same deal if you’re not running a PPC ad campaign.
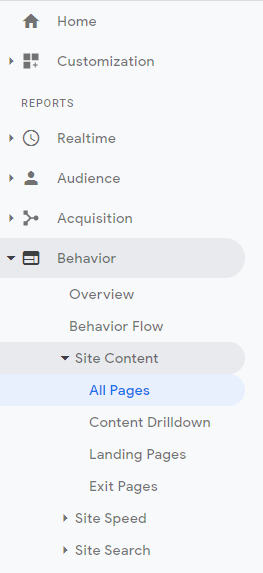
#5: Google Analytics All Pages report
Another useful metric is which pages are being visited and how often.
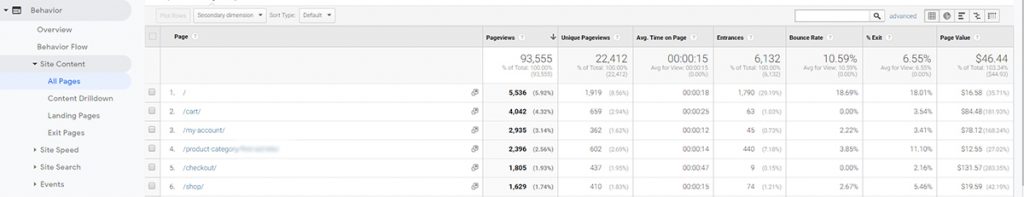
Click on Behavior, then Site Content and All Pages
The All Pages report shows you how many people visited each page, how long they spent on it, how many people entered the site by that page (landing page), what the bounce rate is for that page, and for ecommerce, what the monetary value is for that page. These metrics point to the page quality – how interested are people in reading/buying what’s on that page. This is very useful in determining which pages are performing and which need work.
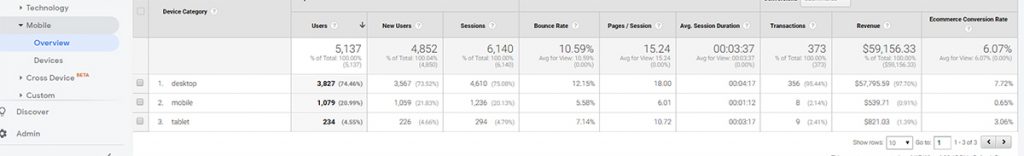
#6: Google Analytics Mobile report
As we live in a mobile-first indexing world now (meaning Google looks at your mobile version first and indexes that before your desktop version), you should be aware of how many visitors are accessing your site from desktop devices vs mobile. This can be very surprising.
In the left panel, choose Audience/Mobile/Overview
And see how many visitors used their mobile devices vs desktops. Business owners make many assumptions in this area. It’s essential that you understand what kind of device most users are viewing your website on, as that can inform many website design decisions.
We encourage you to explore Google Analytics as deeply as possible – it’s an important tool that will shed insight on how well your marketing is working.
Want to have a chat about how we can help with your digital marketing success?